


How DUC Maps Boreal Wetlands

© DUC. A complex of wetlands in Wood Buffalo National Park. Photo by Christopher Smith.
By DUC guest writer: Peter Christie
Published: March 2021
ACROSS THE BOREAL, WETLANDS SERVE AS HUBS FOR NATURE. More than 500 species of birds, fish and mammals call these areas home (at least seasonally), and many are central to the hunting, fishing and trapping efforts of Indigenous peoples and other boreal communities. The millions of often-interconnected wetlands also filter much of Canada’s renewable freshwater and trap vast amounts of peatland carbon from affecting the world’s climate. Protecting wetlands is essential. Knowing where to find them is the first necessary step.
In our Wetlands 101: An Introduction to Boreal Wetlands course, you learned about the five major wetland classes described in the Canadian Wetland Classification System (CWCS), and in our last post, Why Do We Map Boreal Wetlands?, we described why it’s important to map and classify these wetlands across large areas. You also learned how, more recently, DUC has begun using the Enhanced Wetland Classification (EWC) model to distinguish Canada’s wetlands into a further 19 wetland categories. Here, we describe the process of building a wetland inventory: how we map wetlands using the EWC; why we use this approach; and what sets it apart as a versatile and unique guide to boreal conservation and management.
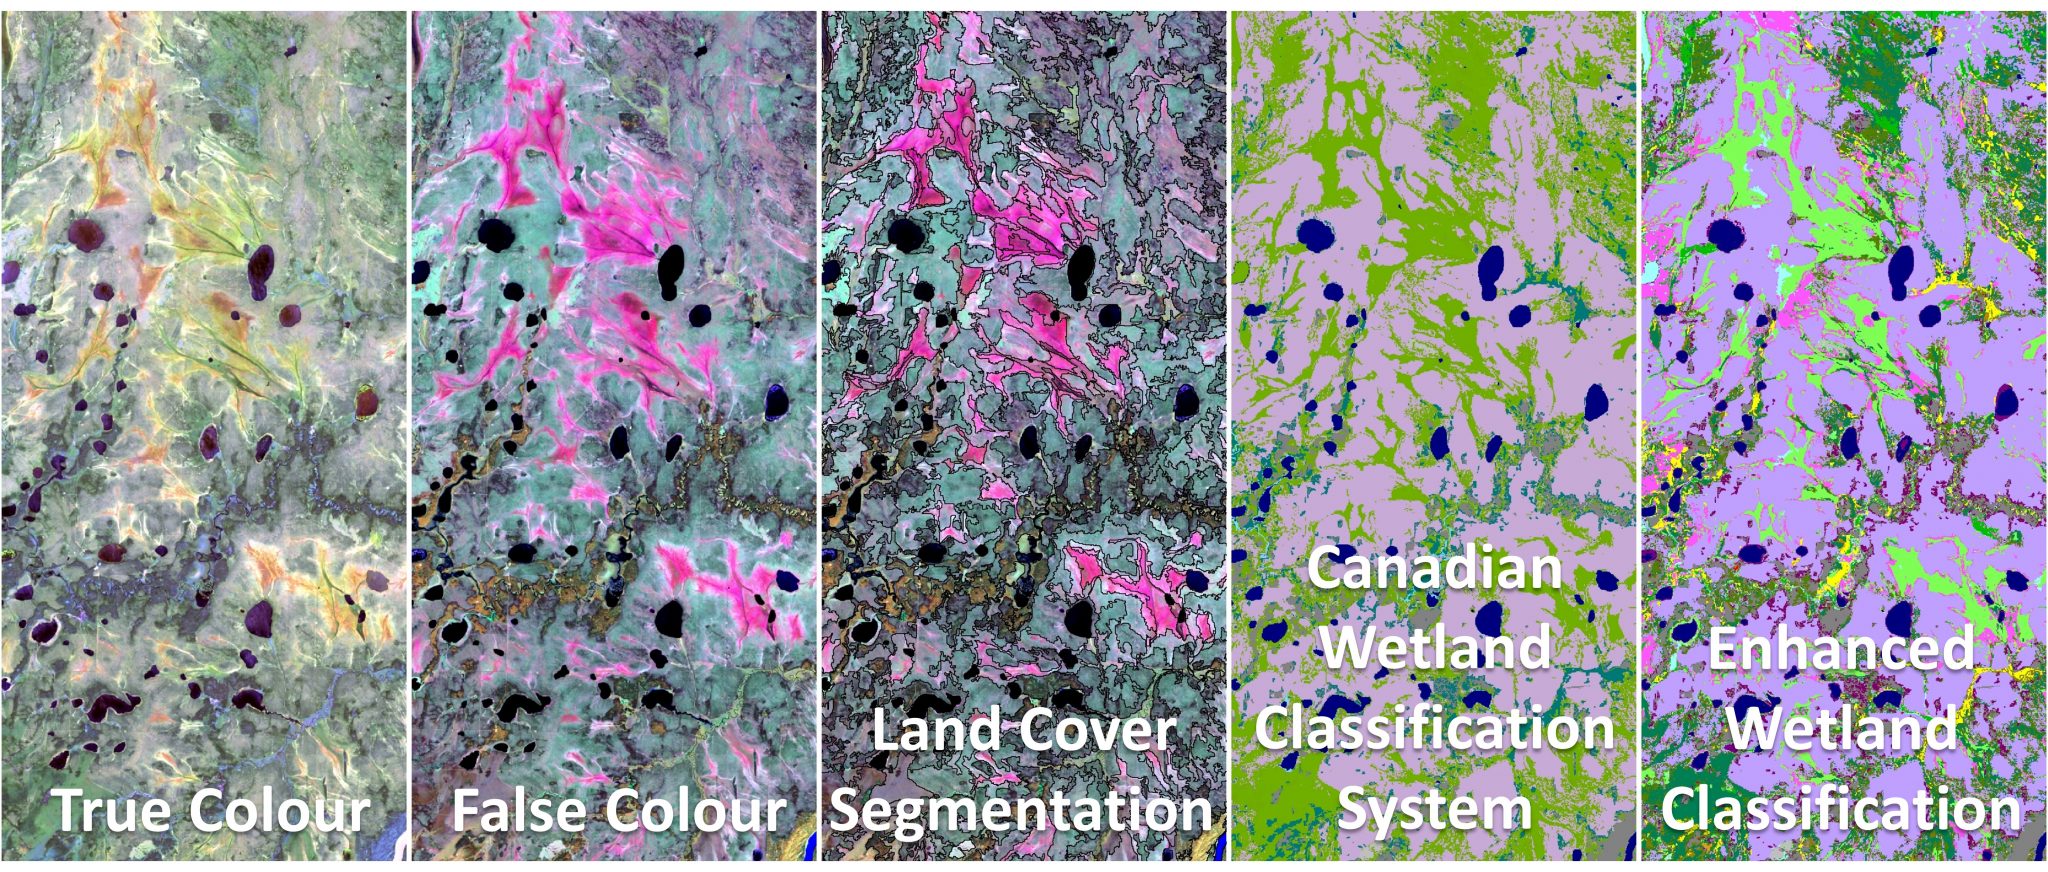
© DUC. Visual Workflow for Enhanced Wetland Classification. (Left to right) True colour, false colour, land cover segmentation, Canadian Wetland Classification System, and Enhanced Wetland Classification.
How does DUC map wetlands?
Canada’s boreal is vast. It occupies more than a third of this country’s total land area (5.45 million square kilometres) and about 85 percent of all the nation’s wetlands. Mapping and categorizing those wetlands—while still capturing a level of resolution and detail useful to forest professionals, conservationists and land-use planners—is a monumental feat. DUC created its wetland mapping approach to meet this challenge.
DUC’s wetland maps knit together, evaluate and verify a variety of what’s known as remote-sensing information to create a large-scale and detailed picture of the boreal’s fens, bogs and other wetlands.
Did you know? Through our GIS and Remote Sensing services, DUC has mapped and inventoried large areas of the Canadian Western Boreal region in collaboration with our partners. Many EWC inventories have already been completed and requested information may be provided under varying data use or licensing agreements.
Discover Our Boreal Wetland Inventories
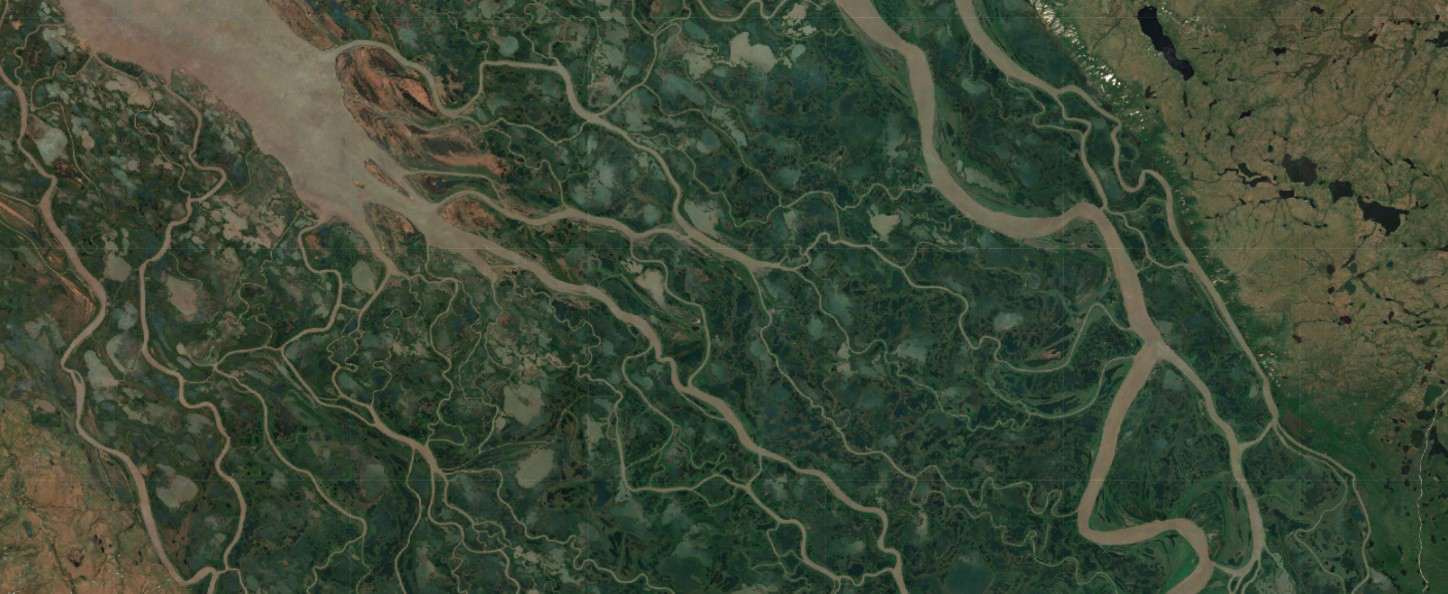
Mackenzie River Delta true colour satellite image.
Remote Sensing is “the science and art” of gathering data about a place or a thing without being in direct contact with it.[i] Remote sensing information is typically detected by overhead instruments aboard planes, helicopters or (increasingly) satellites that capture light and other energy (i.e., radiation) reflected from the surface of an area or object of interest. The reflected energy tells a story.
For example, satellite images of a landscape that show wavelengths beyond those visible to the human eye say something about the health of the vegetation there: thriving plants with ample chlorophyll absorb red and blue wavelengths for photosynthesis and reflect green and telltale infrared wavelengths in return.
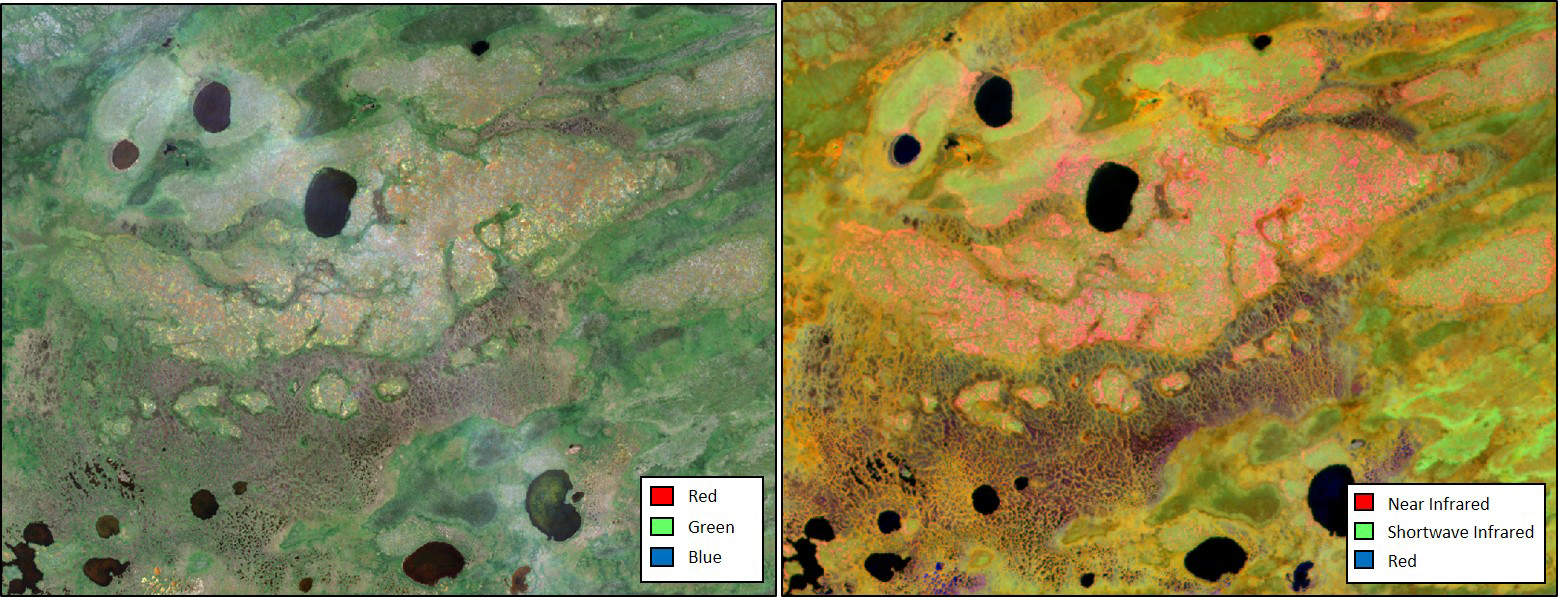
© DUC. Left: True colour satellite image using visible light that can be observed by the human eye. Right: False colour image using infrared energy beyond the visible spectrum.
DUC’s EWC wetland mapping uses remote sensing information from several sources. First, optical satellite images collected from what are known as the Sentinel-2 satellites discern detailed wetland pictures for areas as small as 10-by-10 metres. Overlaying images taken across three seasons means the resulting maps account for vegetation changes over the growing season.[ii]
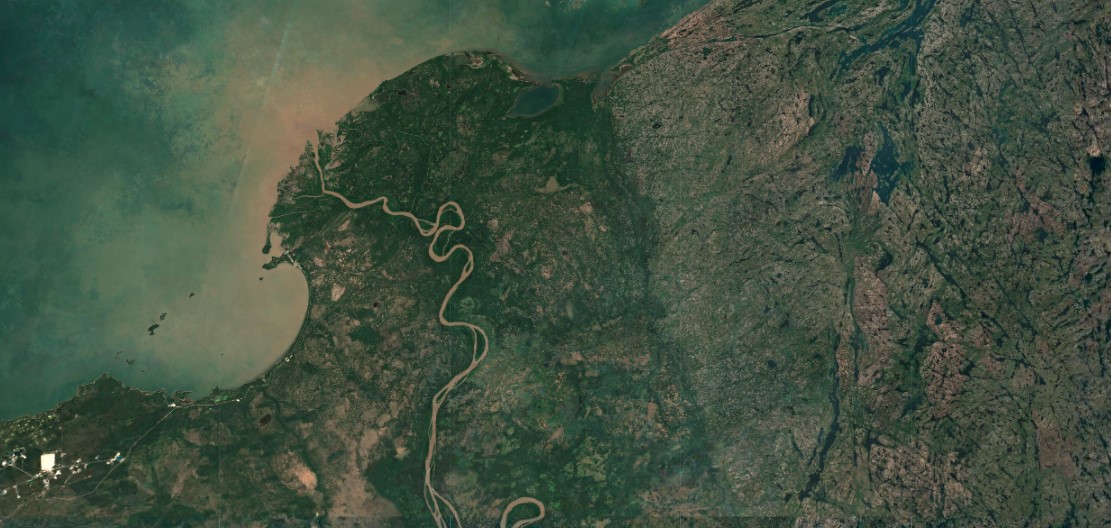
Slave River Delta true colour satellite image.
The optical images are then further enriched by adding radar information from ALOS PALSAR and Sentinel-1 satellites. Radar penetrates through tall vegetation and the forest canopy and can reveal a view of the wetlands beneath. Other satellite information is included using what are called digital elevation models about area topography (e.g., wetlands tend to occupy lowlands).
The information is pulled together and analyzed using both computer-learning techniques and the scrutiny of DUC experts. Trips to the field allow DUC to verify and validate that the wetland information gathered and interpreted using the remote sensing data reflects what’s actually found on the ground.
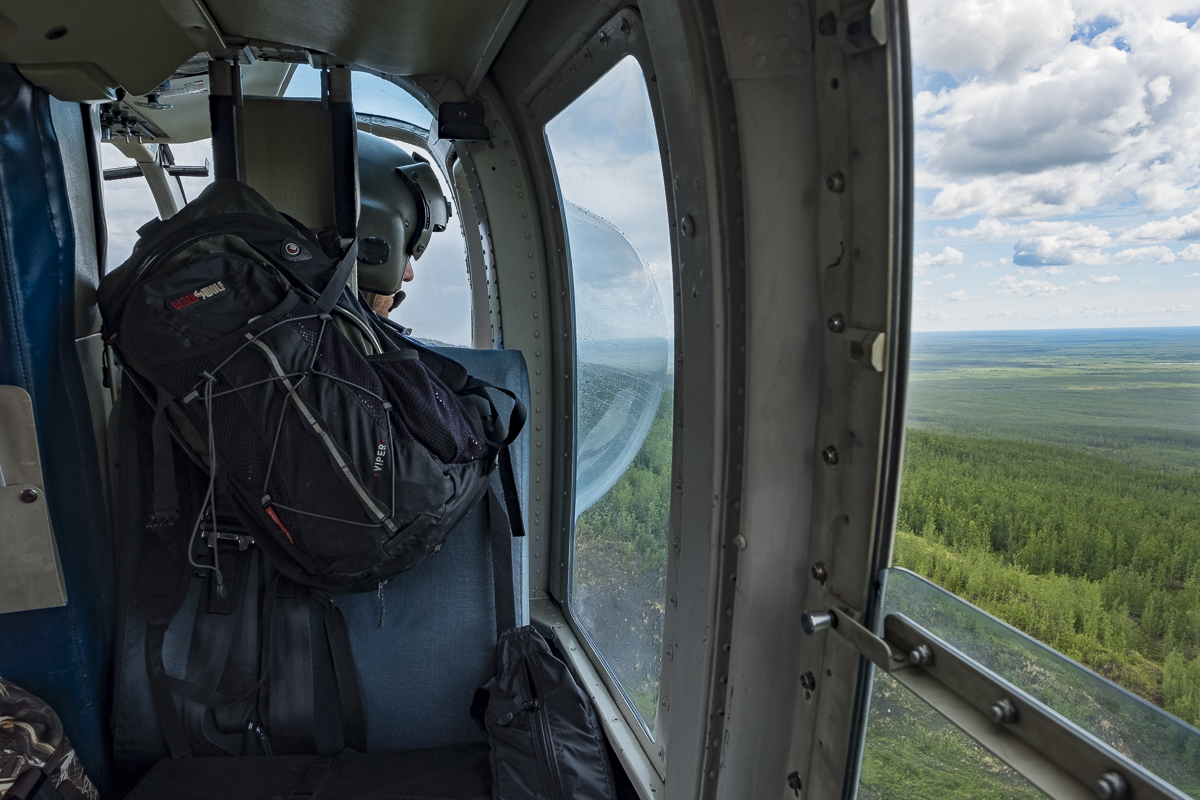
© DUC. Helicopter fieldwork to train and validate our wetland classification Photo by Rebecca Warren.
Why do we map wetlands this way?
The tools and techniques of remote sensing are becoming increasingly sophisticated, allowing information to be gathered quickly and in large quantities over large areas. DUC uses its expertise to take advantage of these developments.
Satellite-based information allows DUC to deliver wetland maps to land managers—which can include Indigenous communities, governments, land use planners, academics, developers, foresters and other resource industries—quickly and over large areas. Analysis and interpretation of this information by DUC wetland experts—combining computer learning with human oversight—along with frequent input from Indigenous communities or industry partners ensures its accuracy.

© DUC. Field validation of remote sensing classification.
Generating up-to-date wetland maps in a timely manner provides an invaluable tool for land managers and others who need to plan and anticipate wetland impacts from development or other landscape changes that are happening all the time.
The 19-class EWC wetland mapping—developed in part by DUC’s National Boreal Programs Manager Kevin Smith—offers a trove of information, refining our understanding of wetland characteristics and providing an invaluable glimpse into how wetlands function and interact across the landscape.[iii]
What makes DUC’s approach to wetland mapping distinctive?
DUC’s EWC wetland mapping is unique. Other mapping efforts with fewer wetland categories generally do not provide the same level of detail. (Groups using the Canadian Wetland Classification System feature just five classes, while the Alberta Wetland Classification System Guide distinguishes 13.) The accuracy and value of these EWC maps relies on DUC’s familiarity with boreal wetlands and its unparalleled interpretative expertise.
EWC wetland mapping allows DUC to do more than simply locate 19 wetland classes across the boreal landscape; it is also useful for revealing the distribution of the various physical and ecosystem characteristics linked to these wetlands. That’s because each class of wetland represented on a map reveals something about the ground, water and climate that created it. These, in turn, determine the types and varieties of plants and animals found in the area as well as information about other characteristics of the area, such as water flows or the depth of carbon-rich peat.
DUC’s wetland maps are unique in forming the basis of other spatial tools for mapping, managing and conserving other key features of boreal nature:
- Gauging biodiversity: DUC built its biodiversity mapping tool by studying how each wetland class is used as primary or secondary habitat for wildlife species, how each wetland class affects the number of species and how closely they are associated with rare species. The tool uses correlations between wetland classes and the unique habitat characteristics relied upon by mammals, birds, amphibians and reptiles as well as characteristic communities of species. The maps provide a picture of where species during different life stages are potentially found and where biodiversity conservation efforts are needed most.
- Measuring waterfowl density: By determining that the number of wetlands within a given area is the best predictor of waterfowl numbers, DUC used its wetland mapping work to generate corresponding maps of where ducks and geese are most abundant in the boreal. The western boreal forest, home to the greatest number of wetlands and lakes in the world, supports about 10 million ducks every spring. DUC refined its waterfowl abundance maps by incorporating other information such as geology, wetland and upland vegetation classes and measures of human disturbance.
- Tracking flows of boreal water: Almost two-thirds of all of Canada’s renewable freshwater drains north through the boreal forest to the Pacific Ocean, Arctic Ocean, and Hudson Bay. The peat beneath boreal wetlands, meanwhile, allows water to move freely through the ground, often connecting with other wetlands, streams, lakes and rivers. DUC is working to categorize different wetlands as either isolated, partially connected or fully connected to this network to understand how wetlands affect annual water budgets and hydrology—a key consideration for planners who want to avoid downstream consequences from upstream development.
- Picturing the boreal’s carbon storehouse: Protecting Canada’s boreal wetlands may be one of the world’s best climate hopes: bog and fen peatlands are part of the largest land-based reservoir of trapped greenhouse gases anywhere on Earth[iv]. While tropical forests (like the Amazon rainforest) store most of their carbon in trees above ground, up to 95 percent of the boreal region’s stored carbon is out of sight beneath the surface, buried away in its soils and peatlands. That’s where the frigid and often-frozen ground and moisture keep the dead plant material from rotting, preventing trapped carbon from escaping back into the air. Over thousands of years, the process has created a long-term greenhouse-gas cold storage the size of which we’re just beginning to understand. That’s where DUC comes in; the organization is combining field data with information about peat depths from published literature to link peat depths with various classes of boreal wetlands. By combining the information with Enhanced Wetland Classification wetland maps, a picture is expected to emerge of the size and distribution of the boreal’s massive peatland carbon storehouse.
- Glimpsing the past to see the future: DUC is using its EWC mapping to compare today’s wetland picture with images from the past. The organization is creating comparable historical imagery of wetlands and wetland classes across the landscape through techniques such as manual digitization or visual interpretation. Remote sensing software can be used to juxtapose and identify differences in land-cover conditions and changes in wetlands at different times in the same region. Documenting and analyzing these changes and their impact on ecosystems over time is critical to understanding the impact of anticipated shifts—such as the effects of climate-related warming—into the future.
Need wetland maps? Through our GIS and Remote Sensing services, DUC has mapped and inventoried large areas of the Canadian Western Boreal region in collaboration with our partners. Many EWC inventories have already been completed and are available under varying data use or licensing agreements.
Discover Our Boreal Wetland Inventories
References
[i] Lillesand, T. M., Keifer, R. W., & Chipman, J. W. 2004. Remote Sensing and Image Interpretation. 5th ed. New York: Wiley
[ii] Merchant, M.A. 2019. An Object-Based Assessment of Multi-Wavelength SAR, Optical Imagery and Topographical Datasets for Operational Wetland Mapping in Boreal Yukon, Canada. Canadian Journal of Remote Sensing
45: 308–332. https://doi.org/10.1080/07038992.2019.1605500
[iii] Smith, K.B., C.E. Smith, S.F. Forest, and A.J. Richard. 2007. Field Guide to the Wetlands of the Boreal Plains Ecozone of Canada. Ducks Unlimited Canada, Edmonton, Alberta. 96 pp.
[iv] Bradshaw, C., & Warkentin, I. 2015. Global estimates of boreal forest carbon stocks and flux. Global and Planetary Change 128: 24-30.
About the author
Peter Christie is a science writer and author who writes frequently about conservation. His most recent book is “Unnatural Companions: Rethinking Our Love of Pets in an Age of Extinction”.